Found some data on sea level changes in relation to temperate increase in the coastal cities of Durban, Cape Town, Lagos, Mombasa and Dar es Salaam. I was able to create a visualization of this data as seen below.
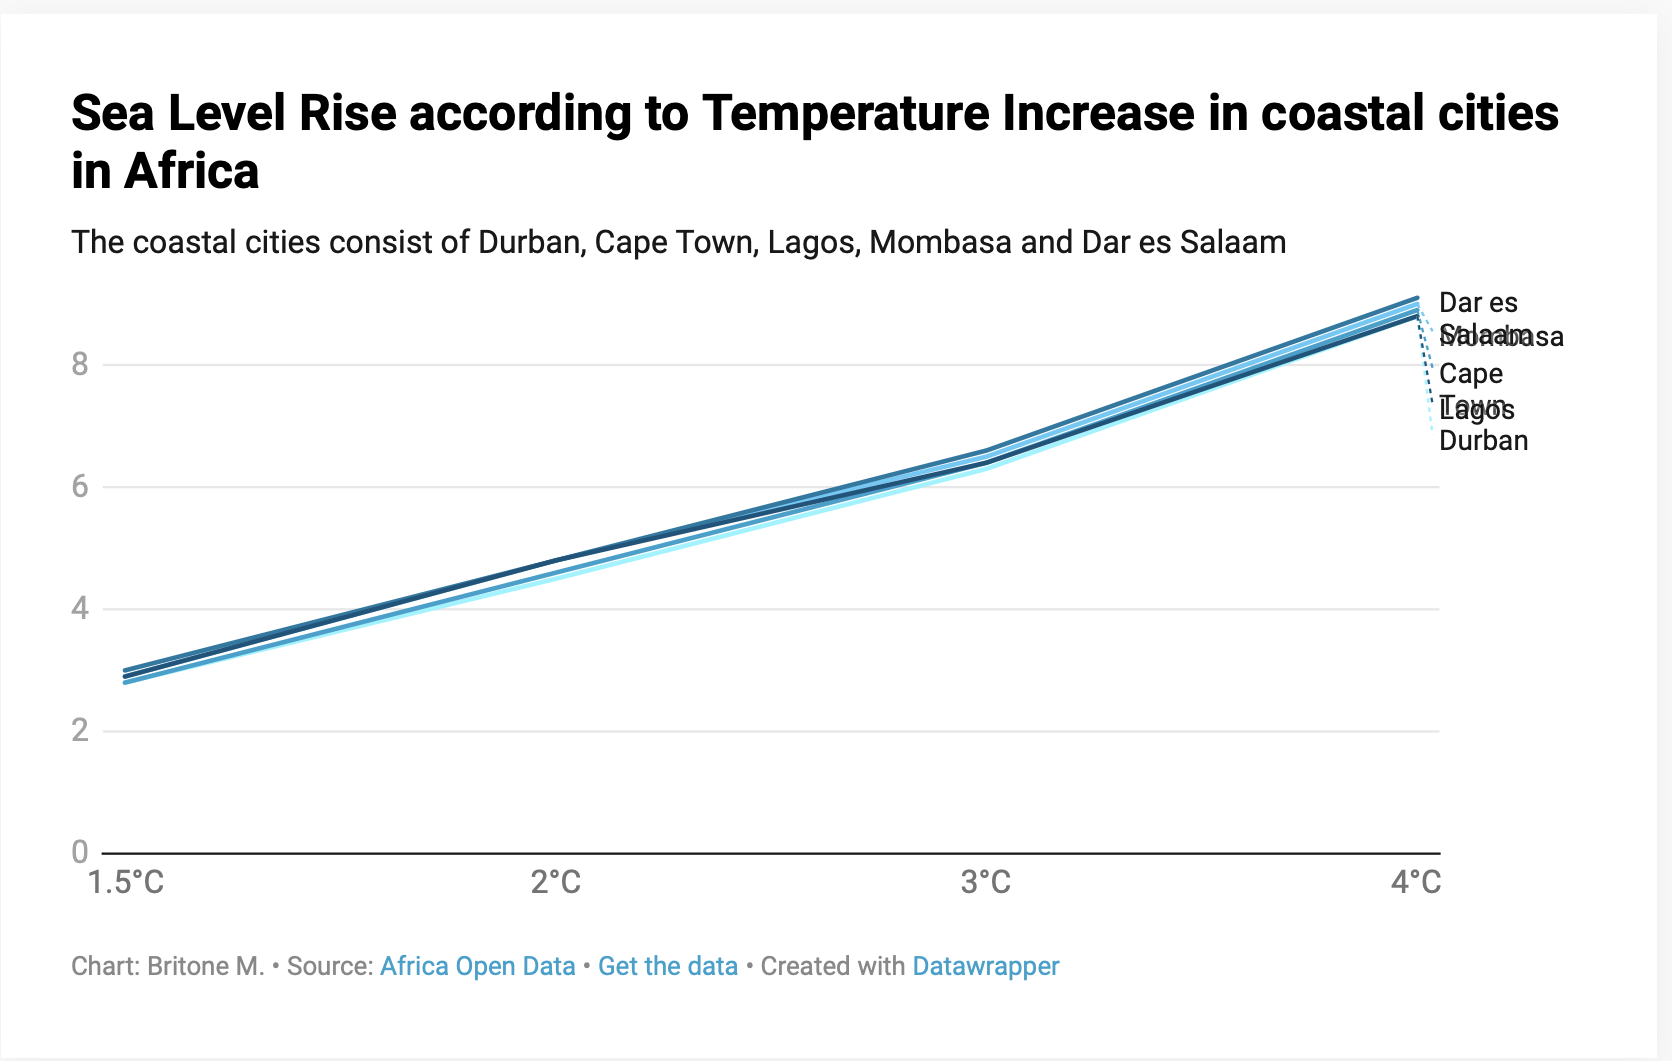
Note this data is from 2017, should I find any recent data I will be able to update. For a more interactive view please click https://www.datawrapper.de/_/9vfPX/

Leave a comment